
I'm writing this post to raise awareness for families whose child hasn't yet started school, or who are moving from primary to secondary school or from secondary school to sixth form. If you have a choice, I wanted us to think together about how to choose a school.
Before we start, let's ask ourselves a few questions:
“This is England; doesn't every school teach to a certain standard anyway? Why would we need to choose a school?”
“Isn't it most sensible to go to the school nearest our home?”
“Doesn't the council allocate children to schools anyway? Can we really choose?”
These questions sound very familiar, don't they? In fact, many of us have similar thoughts. That's exactly why I wrote this post: to look at these questions together, and to talk about how we can weigh up the options we have.
To make it easier to follow, I'll organise the post under the headings primary school, secondary school and sixth form .
Parents whose children have already finished primary school can skip straight to the other headings if they wish.
Let's get started.
Choosing a Primary School
If your child isn't yet of school age and you're applying for primary school for the first time, you need to apply for a Reception place.
Reception is the first year of primary school. The application for Reception must be completed by 15 January of the school year in which your child turns 4. This can sound a little confusing, but it's actually quite clear. The table below shows, depending on your child's date of birth, which year you need to apply in and the deadline:
Reception Application and Start Dates
|
Child's Date of Birth |
Reception Start Date |
Application Deadline |
|
1 September 2020 – 31 August 2021 |
September 2025 |
15 January 2025 |
|
1 September 2021 – 31 August 2022 |
September 2026 |
15 January 2026 |
|
1 September 2022 – 31 August 2023 |
September 2027 |
15 January 2027 |
It's very important not to miss this deadline!
Your child may already go to a Nursery, and there may even be a primary school linked to that nursery. But that doesn't mean they'll automatically get a place at that primary school.
You must apply for Reception through your council. If you don't apply, your child isn't guaranteed a place.
When applying to the council for primary school, you'll be asked to rank schools in order of preference. The number of schools you're asked to rank can vary by council, so before applying you should check with your council and rank as many schools as they ask. For example, if your council asks you to choose 6 schools and you only list 3, that doesn't mean you're guaranteed a place at one of those 3.
In this post we'll look at how to decide on your ranking . Of course, that doesn't mean you'll get the first school on your list. I explained how places are allocated in another blog post. You can find it here.
Now let's focus on our main topic: How can you decide on your ranking?
Of course, statistics and numbers can sometimes be misleading, and it may not be right to decide based on a single figure. But to get some initial information about a school, you can look at this government website .
On this free website you can see a list of all the schools in your council area, or look at schools around your postcode. When assessing schools, comparing at least three will help you understand what the school you're considering is like in certain respects.
When you go to a school's page on the website above, you'll find 3 main headings, as below:
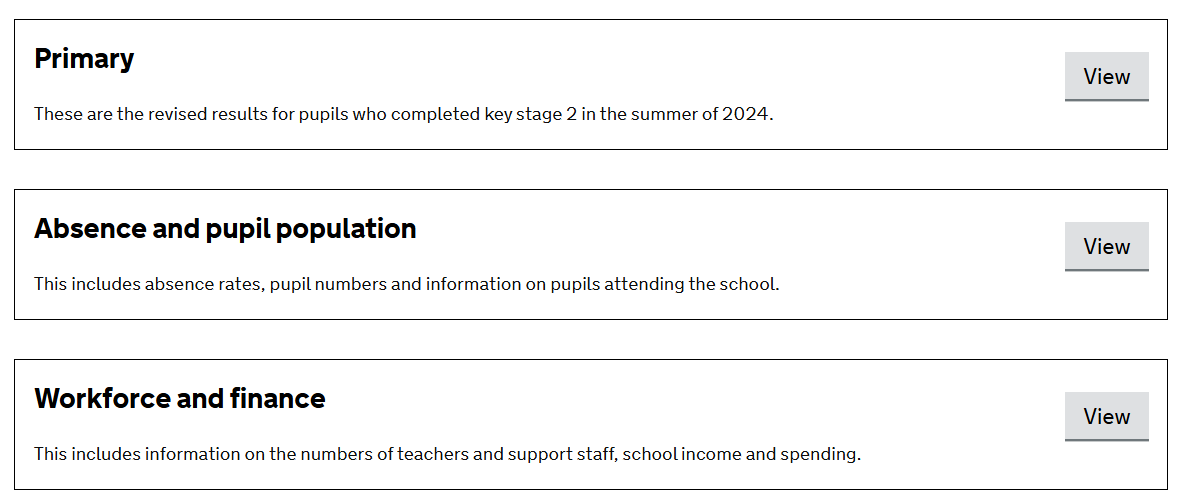
1. Primary (compares the academic level of the school's leavers with the council and England averages)
2. Absence and Population (covers absence rates, pupil numbers and information about the pupils who attend the school)
3. Workforce and Finance (covers the number of teachers and support staff, along with the school's income and spending)
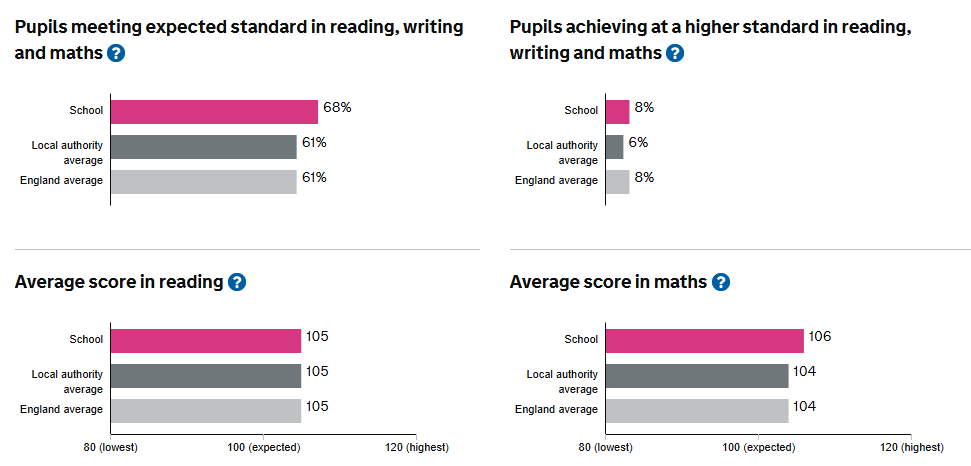
On the Primary page, you'll first see four charts. In each area, these charts let you compare:
- the school's own results,
- the average for the school's council area,
- and the overall average for England
.
Before looking at the charts, it helps to know that England has a national curriculum that all schools teach, and pupils are expected to understand it to a certain level.
In this context, at the end of Year 6, pupils across the country take the SATs . These tests cover English and maths, and scores range from 80 to 120. The expected standard is a score of at least 100.
- Scores below 100 are “below the expected standard”,
- 100 and above is “at the expected standard”,
- and 110 and above is the “higher standard”.
What the Charts Mean:
- Chart: shows what percentage of last year's leavers met the expected standard.
- Chart: shows what percentage of last year's leavers achieved the higher standard.
- Chart: shows last year's leavers' average reading score.
- Chart: shows last year's leavers' average maths score.
Looking at a single school on its own in these reports may not give you a full, accurate picture. That's why the England average and the council average are added to the charts for comparison. But averages can be misleading too. So, as I said before, I recommend looking at at least three different schools.
You can also find more data on the same page under these headings:
- Additional measures
- Results by pupil characteristics
- Progress measures for the academic year
But I'll leave those parts to you for now.
Heading 2: Absence and Population
In this section you can find the following information about the school's pupils:
- The ratio of girls to boys
- The proportion of pupils whose first language isn't English
- The proportion of pupils receiving SEN (Special Educational Needs) and EHCP (Education, Health and Care Plan) support
- The proportion of pupils eligible for Free School Meals
This data is useful for understanding the socio-economic and cultural make-up of the pupils and parents. If you have a child who needs special educational support (SEN), this section is especially important for understanding the level of support the school can offer.
Heading 3: Workforce and Finance
Under this heading you'll find the following information about the school's teaching and support staff:
- What percentage of teachers are “qualified”
- How many teaching assistants there are
- The school's annual budget
This information can be meaningful for parents particularly interested in the quality of teaching. This section shows how the school uses its resources, the experience level of its teachers and its overall staffing.
All of the information above is very valuable. But remember that it's statistical and isn't updated in real time (the data is usually from 1 or 2 years before the year you're looking at), so it can sometimes be misleading.
Another report worth knowing about is the Ofsted report. I explained what Ofsted is in another blog post. If you haven't read it yet, I recommend reading it here .
To continue this guide on what to look for when choosing a primary school, you can read the Secondary School Choice Guide , or, to find out what else to look at beyond academic results, take a look at this post.
If you'd like to share your own experience of this, please get in touch. And if there are other topics you're curious about or questions you have, please mention them in the comments.